Introduction
A sustainable food system should have a neutral or positive environmental impact, aid in climate change mitigation, reverse biodiversity loss, and provide food security. Achieving a sustainable food system within Europe is the goal of the “Farm to Fork strategy”, a project in line with the United Nations’ Sustainable Development Goals (SDGs). The report “Key figures on the European food chain” is tied to the “Farm to Fork Strategy” and it aims to describe the EU’s food chain, from primary production to consumption, to gain an overview of the state of the food chain in 2023.
Farms and farm labor force
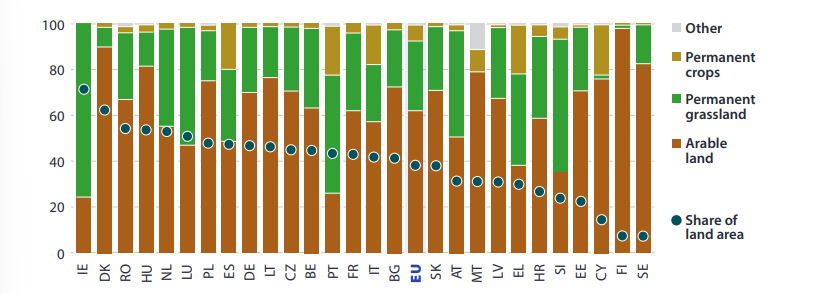
-> According to the article, Europe significantly contributes to the global agricultural sector. In 2020, the utilized agricultural area covered up to 157.4 million hectares, which translates to 38.4% of its land.
- France (17.4%) and Spain (15.2%) accounted for the largest areas utilized agricultural areas in Europe.
- Farmers used most land (62.3%) to produce crops and livestock farms (21.7%).
- From 2010 to 2020, farms shifted from livestock and mixed types to crop-focused.
In 2020, the EU counted 9.1 million farms, which was 3 million fewer than in 2010. Employment in agriculture also decreased in all EU member states, from 5.65% employment share to 4.3%.
Organic farming
The “Farm to Fork Strategy” promotes organic farming as a sustainable alternative and targets a 25% conversion of agricultural land to organic processes by 2030.
-> Organic farming rose by 70% in all EU states (except Poland) from 2012 to 2021, accounting for 9.1% of Europe’s total farmland.
Food Crop production
Weather, soil quality, nutrients, and pests directly affect farmers’ crop production throughout the growing season and harvest. Extreme weather in the EU in 2022, rising input costs, and global trade disruptions like Russia’s aggression against Ukraine, all led to lower crop yields and higher prices. According to the report “Key figures on the European food chain,” the following information can be found about crops in Europe:
- Cereals are the most cultivated, with a total of 270.9 million tons of cereals produced in Europe. Wheat accounts for almost half of the cereals (49.6%).
- Potatoes farming also covered a great area of about 1.4 million hectares, mostly spread across Germany, France, and the Netherlands.
- For fresh vegetables, the three most produced were tomatoes, onions, and carrots. Spain was the leading producer (23.7%), followed by Italy (20.8%).
- Italy, Poland, Spain, and France, the main fruit producers, contributed to a total harvest of 25.4 million tons.
To read more about how conflict can affect value chains, read the following summary article:
Food chain: meat and dairy production
The EU’s Farm to Fork Strategies aim to lessen livestock’s environmental impact and enhance animal welfare. However, Europe still houses a significant number of livestock, despite a decline from 2002 to 2022. EU farms are home to an estimated 134 million pigs, 75 million bovines, and 70 million sheep and goats.
Patterns in meat production changed across Europe in the last decade: while pigmeat, sheep meat, and goat meat production decreased, poultry meat production increased by 44.5%. In 2022, and the Eurostat’s report estimated raw milk production at 160 million tons, mostly from cows for dairy products like milk, whey, butter, and cheese. Germany led the dairy production, followed by France, Italy, and the Netherlands.
Fishing and aquaculture
The European Commission seeks to restore fish populations to sustainable levels within the context of the “Farm to Fork Strategy” by decreasing wasteful discarding, improving traceability, and strengthening fisheries.
In 2021, the EU predicted its fishery products to total 4.6 million tons of live weight, a 5.8% drop from 2020 and 19.9% less than 2006, split between catches and aquaculture. The most fished species are herring, tuna, and mackerel, while the most farmed species in aquaculture are trout and seabass.
Processing of food and beverages
The food chain encompasses much more than fundamental agricultural production; it also includes food and beverage processing, distribution, and service.
This sector is particularly important in the European Union, and the following information may be found in the study “Key figures on the European food chain“:
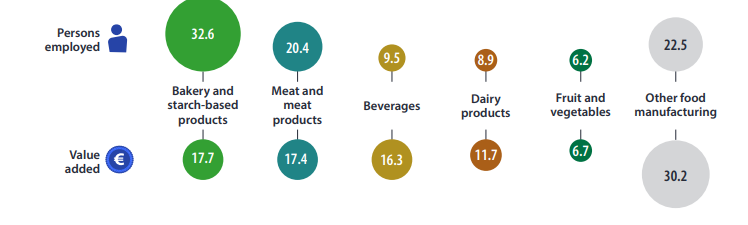
- In 2020, the EU had 291,000 Food and beverages (F&B) processing enterprises, 14.1% of all manufacturing enterprises.
- F&B processing employed 4.6 million workers.
- The value added by food and beverage processing firms was €227 billion, over 30% higher than that of agriculture.
Trade in the European food chain
Trading goods with non-member countries brought Europe €222 billion in 2022, is therefore very clear how important trade is for the European member countries. The EU is largely self-sufficient in agricultural commodities, so the most exported products are processed F&B products:
- In 2022, Eurostat valued F&B products to nonmember nations at €116.0 billion, over double the value of our imports at €56.7 billion.
- The Netherlands (with a trade surplus of €35.5 billion), Spain (€15.1 billion), Poland (€12.5 billion), and France (€10.1 billion) were the largest net exporters of agricultural, fishery, and F&B products in 2022 among EU Member States.
Wholesale, retail, and services
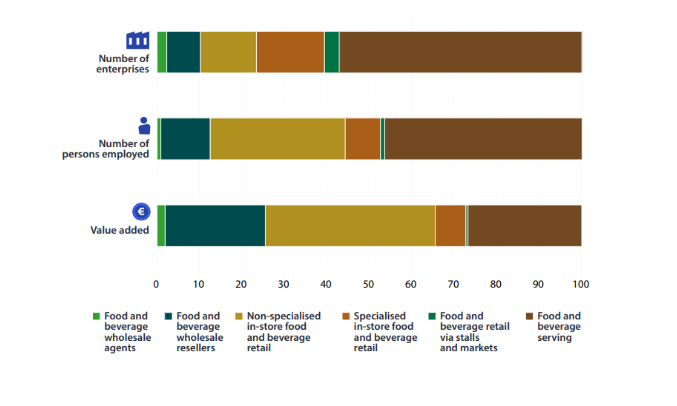
There were 2.6 million F&B trade and serving enterprises in the EU in 2020: 265,000 wholesalers, 851,000 retailers, and 1.5 million F&B serving enterprises. They employed a total of 15.7 million people, generated €2.5 trillion in revenue, and added €400 billion in value.
With such important numbers and influence, it is a high priority of the EU’s “Farm to Fork Strategy” to seek collaboration from these companies on a variety of health and sustainability issues, such as reformulating food goods by healthy diet guidelines and decreasing pollution.
Consumption, prices, and food affordability
In 2021, Eurostat estimated the EU’s total final consumer expenditure on food, beverage, and catering services at €1.55 trillion, or €3,470 per person. In comparison to 2020, household spending on F&B and catering services increased by 6.0% in 2018.
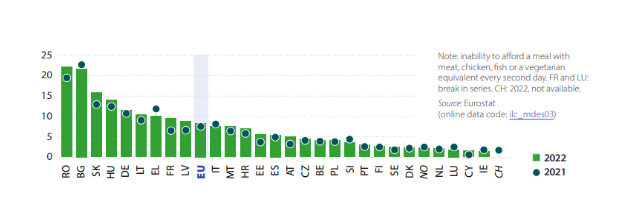
Prices drive customers’ food and drink choices, unsurprisingly causing a cost-of-living crisis due to their rapid increase. Data in 2022 showed that 8.3% of all European households could not afford a protein-rich meal.
Food chain: environment
Despite agriculture’s importance, it is also a significant contributor to pollution and climate change. For instance, a 2011 survey revealed that Europe used 10 million tons of nitrogen and 1.1 million tons of phosphorous fertilizers, leading to environmental pollution. However, the risk from pesticide use dropped by 38% in 2021 compared to a decade earlier, indicating progress, although misuse remains a concern.
Alarmingly, EU agriculture emitted 378 million tons of CO2-equivalent gases in 2021, with France leading in methane and nitrous oxide emissions. Lastly, agriculture significantly impacts waste production, with an average of 131 kg of food waste per EU citizen in 2021, primarily originating from households.
Source
- Key figures on the European food chain – 2023 edition. (n.d.). Eurostat. https://ec.europa.eu/eurostat/web/products-key-figures/w/ks-fk-23-001
Related articles to On the European Food Chain
Many customers and visitors to this page 'On the European Food Chain' also viewed the articles and manuals listed below: